Fidelity Asian Values PLC - taking stock 25 years on

As Fidelity Asian Values PLC turns 25 years old, portfolio manager Nitin Bajaj reviews how the dramatic changes seen in Asia
have shifted the centre of economic gravity shift from West to East - and are mirrored in the growth of the trust. As he reflects
on the highs and the lows for investors, he examines the key lessons learned from the markets over the years.
Key points
- The Asian story, seen alongside China’s rapid emergence, still has many years to go as newer population blocks seek to imitate China’s economic policy playbook.
- For us, the most important lesson of this 25-year period has been the importance of avoiding speculative excesses in order to preserve capital.
- We remain focused on owning good businesses run by honest people and owning them at attractive prices.
It has been 25 years since the launch of Fidelity Asian Values PLC - a period which has seen Asia move from the fringes of global economic development to be the centre of it. This journey is very much mirrored by various stages in the growth of the trust.
An investment of £1,000 invested in the trust at launch would have returned £5,725 compared with £4,130 if the same sum had been invested in the MSCI Asia ex Japan Index and £4,504 if invested in the FTSE 100.

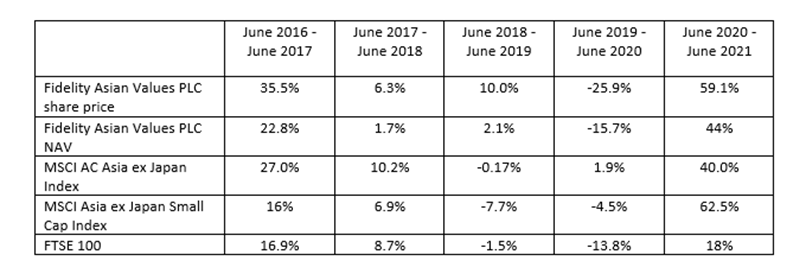 Source: Fidelity International, 30 June 2021. Based on total return in GBP terms. MSCI Asia Pacific Ex Japan Small Cap Index replaced MSCI Asia Pacific Ex Japan as official benchmark from 1 February 2020.
Past performance is not a guide to the future.
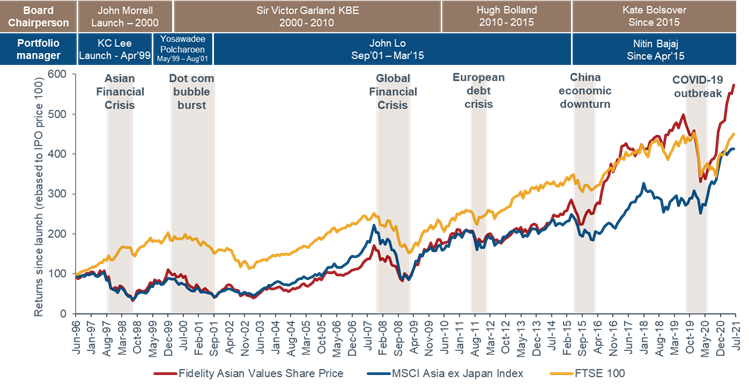 Source: Fidelity International, Refinitiv Eikon Datastream, 30 June 2021
The launch and the first few years
The trust was launched in 1996 under the stewardship of John Morrell as Chairman of the board and K.C. Lee as portfolio manager. It was originally expected to invest primarily only in Singapore, Korea, Thailand, Hong Kong and Malaysia.
To think of an Asian portfolio without China, India, Indonesia, Philippines and Vietnam - the five largest population blocks in Asia - may seem strange today, but this change of mindset encapsulates Asia’s journey over last 25 years. Indeed, it’s been a journey where capitalist policies (with different twists and turns in individual countries) have unleashed immense productive capacity leading to economic growth and social welfare in these countries.
What has happened in China in last 25 years is nothing short of a miracle. Furthermore, based on what we currently see on the ground, this journey in Asia still has further to go as newer population blocks seek to imitate the Chinese economic policy playbook.
 Global GDP versus Asian GDP over the last 25 years

Source: World Economic Outlook Database, April 2021
However, like with many journeys, it hasn’t been all smooth sailing. Straight after the trust’s launch, the Asian economy hit a substantial speed bump with the Asian Financial Crises, which derailed the fundamentals of many companies. Between August 1997 and August 1998, the trust declined by 70%, with the share price hitting a low of 33p against a launch price of 100p in just over two years.
Over the next five years, the world stumbled from one accident to the next - first, a stock market boom and then a crash led by shares in ‘new economy companies’ followed by the September 11 terrorist attacks in United States in 2001 and finally the SARS epidemic in Asia in 2002/2003.
The stock price of the trust was 40p as of 31 March 2003. It is fair to say that it was a difficult start for the trust.
During these turbulent times the trust undertook two portfolio manager changes, culminating in John Lo being appointed as manager in September 2001. John expanded the investment remit across Asia to include India, China, Taiwan as well as Australia and New Zealand. He also took a more active interest in mid-cap opportunities thus expanding the investable universe of the trust.’
The boom, the bust and the great recovery
The recession in the wake of the triple-hit of the technology bubble busting, 9/11 and the SARS virus outbreak was followed by an equally unprecedented economic and stock market upcycle. This was the period which started to see China take centre-stage. It was also a time marked by a surge in commodity prices, strengthening Asian stock markets and rising global house prices.
From an asset allocation perspective, it was a period where Asian stock markets became mainstream and a core holding in portfolios. The share price of the trust and shares in Asian markets did well during this timeframe, appreciating by almost 400%. By October of 2007, Asian Values was trading at 170p a share.
The period between 2003 to 2007 was also a period of heavy investment by Fidelity in Asia, with our research resources expanded considerably to keep up with the growing number of companies being listed in the region. Research presence was built in Seoul, Mumbai, Singapore and Shanghai in addition to existing bases in Hong Kong, Sydney and Tokyo.
However, around this time the housing bubble in the US was starting to deflate, leading to significant bank failures in America - the catalyst of the Global Financial Crisis. Asia was not immune to this crisis and experienced a significant decline in corporate profitability. The market gave up most of the gains from the bottom in 2003 and trust was trading at 73p after the collapse of Lehman Brothers.
John Lo’s talent for spotting recovery stocks, aided by our depth of research, laid the foundation for a resurgence post-crisis with strong absolute and relative returns until March 2015 when John stepped down as portfolio manager. The NAV and share price of the trust had increased to 295p and 263p respectively by March 2015.
The shift to ‘small cap-value’
Although the trust performance was satisfactory, the board, under the stewardship of Kate Bolsover, decided to move to a small-cap strategy with a view to better access the large pool of smaller businesses listed across Asia, while also better utilising the trust’s closed-ended structure.
Given my bias towards small-cap value investing, it was a logical step for me to take over running the trust in April 2015.
Notably, over the first 20 years of the trust’s existence, small-cap value had outperformed all other styles in Asia. The board felt that this would be an interesting route to take given Fidelity’s research depth and my investment style.
After an initial three-month transition period, the trust was moved to a portfolio of high-quality small cap stocks which were either ignored by the broader market or yet to be discovered. This has resulted in a period of strong relative and absolute returns over the last six years, despite the fact that this has been a period where value as an investment style has struggled to keep up with more growth-oriented stocks and sectors.
Fidelity Asian Values PLC has outperformed against other benchmarks
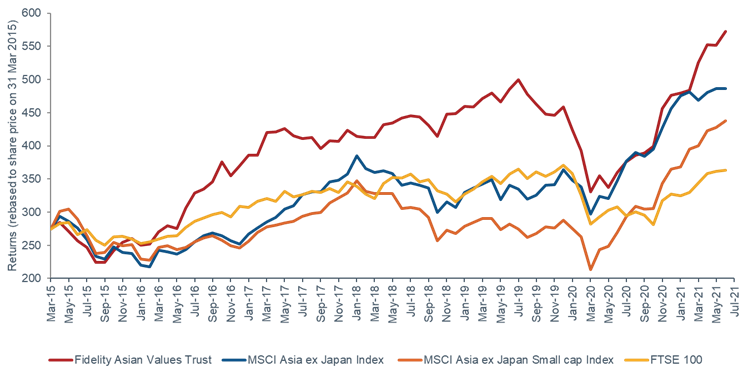 Source: Fidelity International, Refinitiv Eikon Datastream, 30 June 2021
Past performance is not a guide to the future
Growth vs Value debate
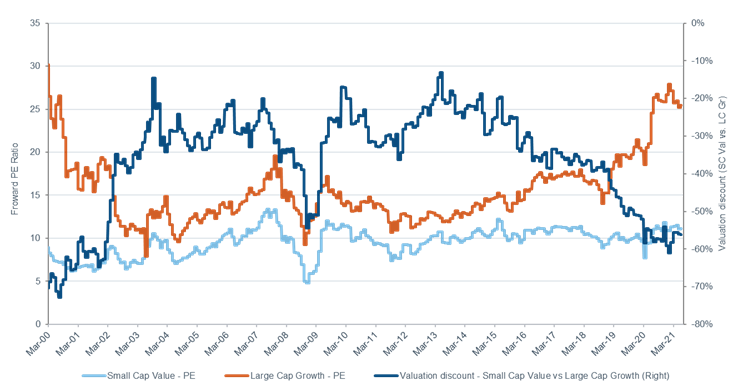
So, where do we stand today and what can we expect in the future? The pivot towards growth stocks between 2016-2020 has led to the widest dispersion between growth and value stocks in almost 100 years - similar to 1999.
Widening valuations in PE ratios of small-cap value stocks vs large-cap growth stocks
 Source: Fidelity International, 30 June 2021
This is not abnormal or inconsistent with history - this is the normal cycle of markets. As the last 25 years have shown, markets are prone to excesses and depressions - both of which tend to mean revert and correct. Whether it was predictions in 1999 that the ‘old economy was dead’ or predictions in 2007 of ‘peak oil’, market hyperbole is seldom correct.
There is no reason to believe that this time will be different. We continue to believe that the most time-tested way to preserve and grow capital is to own good businesses run by honest people and buy them at a margin of safety. The trust is fully focused on owning quality businesses at attractive prices.
The aggregate data and individual holdings of the trust continue to reflect this philosophy. We own a set of businesses which make superior return on equity to the market but are available at much cheaper valuations.
Lessons from last 25 years
Studying the history of the trust over last 25 years has been instructive with a few clear lessons:
- Economy: Asia has witnessed a miracle over the past 25 years, with China leading the way. The key was unleashing the power of capitalism to raise productivity levels in China. There are still four big population centres of India, Indonesia, the Philippines and Vietnam with an opportunity to raise productivity levels significantly over the next 20 years.
- Markets: Markets go up and down - often by a lot. Since launch, the share price of the fund has had a drawdown of more than 10% on 15 occasions, of which four times it fell more than 25%. The world and investor behavior are not forecastable and often emotional.
- Emotions: Although significant decline has been an opportunity to buy, doing so when being scared is very difficult. Similarly selling over-hyped stocks when they are doing well can be equally as difficult. It is important to emotionally detach yourself. Be fearful when others are greedy, be greedy when others are fearful.
For us, the most important lesson of this period has been that to preserve capital, one has to avoid speculative excesses. As equity investors, we will not be able to avoid the volatility of stock markets but by avoiding ‘hot areas’ and inferior businesses we can avoid permanent loss of capital.
Owning good businesses run by honest people and owning them at attractive prices gives us the best chance to accomplish this. The board, the portfolio manager and Fidelity’s research team are focused on making sure that we stay true to this.

Find out more about Fidelity Asian Values PLC here >
Important information
The value of investments and the income from them can go down as well as up, so you may get back less than you invest. Past performance is not a reliable indicator of future returns. If you are unsure about the suitability of an investment you should speak to an authorised financial adviser.
Investors should note that the views expressed may no longer be current and may have already been acted upon. Investments in small and emerging markets can be more volatile than other more developed markets. Changes in currency exchange rates may affect the value of investments in overseas markets. The trust can use financial derivative instruments for investment purposes, which may expose them to a higher degree of risk and can cause investments to experience larger than average price fluctuations. The shares in the investment trust are listed on the London Stock Exchange and their price is affected by supply and demand. The investment trust can gain additional exposure to the market, known as gearing, potentially increasing volatility. Investments in smaller companies can carry a higher risk because their share prices may be more volatile than those of larger companies. Reference to specific securities should not be construed as a recommendation to buy or sell these securities and is included for the purposes of illustration only.
The latest annual reports and factsheets can be obtained from our website at www.fidelity.co.uk/its or by calling 0800 41 41 10. The full prospectus may also be obtained from Fidelity. The Alternative Investment Fund Manager (AIFM) of Fidelity Investment Trusts is FIL Investment Services (UK) Limited. Issued by Financial Administration Services Limited, authorised and regulated by the Financial Conduct Authority. Fidelity, Fidelity International, the Fidelity International logo and F symbol are trademarks of FIL Limited.
UKM0721/36216/ISSCSO00016/NA
Read the latest edition of DIY Investor Magazine
DIY Investor Magazine
The views and opinions expressed by the author, DIY Investor Magazine or associated third parties may not necessarily represent views expressed or reflected by EQi.
The content in DIY Investor Magazine is non-partisan and we receive no commissions or incentives from anything featured in the magazine.
The value of investments can fall as well as rise and any income from them is not guaranteed and you may get back less than you invested. Past performance is not a guide to future performance.
DIY Investor Magazine delivers education and information, it does not offer advice. Copyright© DIY Investor (2016) Ltd, Registered in England and Wales. No. 9978366 Registered office: Mill Barn, Mill Lane, Chiddingstone, Kent TN8 7AA.

