
Don't discount the discounted
The ability to buy shares at a discount to NAV is one of the differentiating features of investment trusts versus open-ended funds and means they can potentially offer higher returns. Of course, with this come brings extra risks, and the pandemic saw discounts widen across the board, compounding losses made on NAV. However, perhaps the time has come where the risk/reward rewards ratio needs to be reassessed and this could indeed be an interesting to look at some heavily discount opportunities.
How have discounts responded to the pandemic?
The emergence of the pandemic in late February saw the weighted average discount on the investment trust sector widen sharply, but since then much of the ground has been made back. As the graph below shows, the current discount of 3.6% is the tightest it has been since the crisis. However, it is still not quite back to the levels of January, when it narrowed in to 2%.

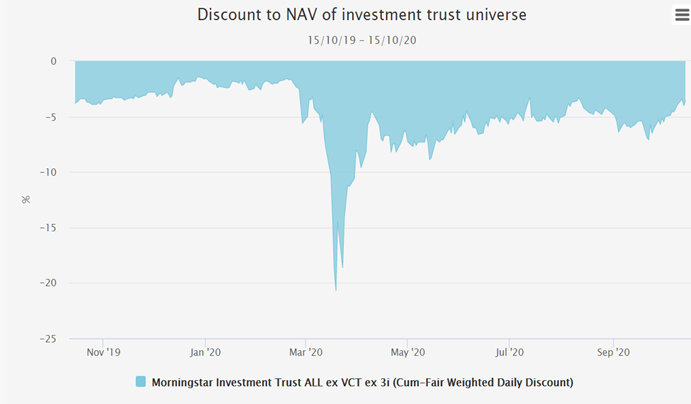

Source: Morningstar
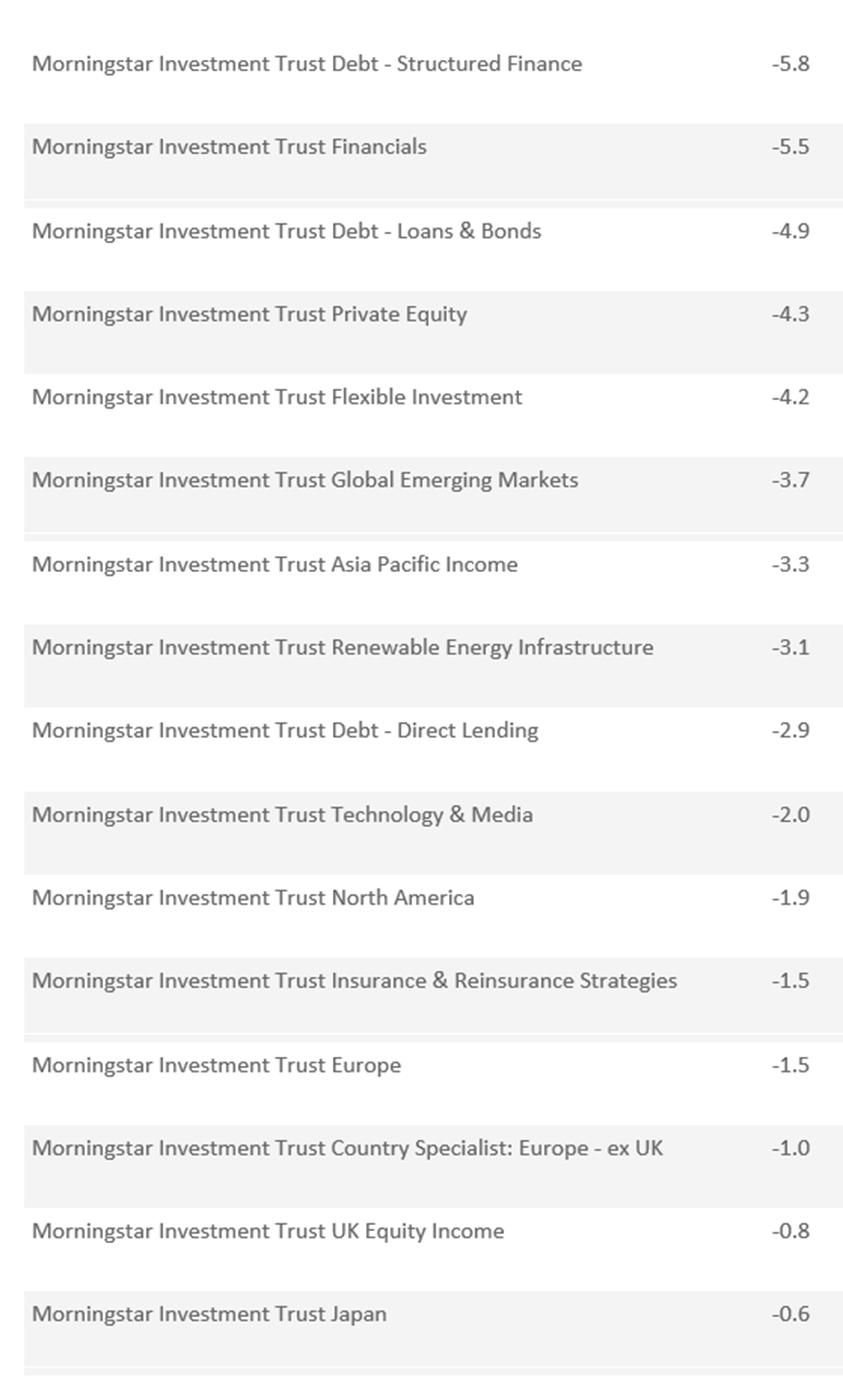
Whilst the overall picture is encouraging, the data hides a wide disparity in sector moves. The table below illustrates the change in the discount of the Morningstar investment trust sectors which have seen a widening since the start of 2020.

DISCOUNT MOVE
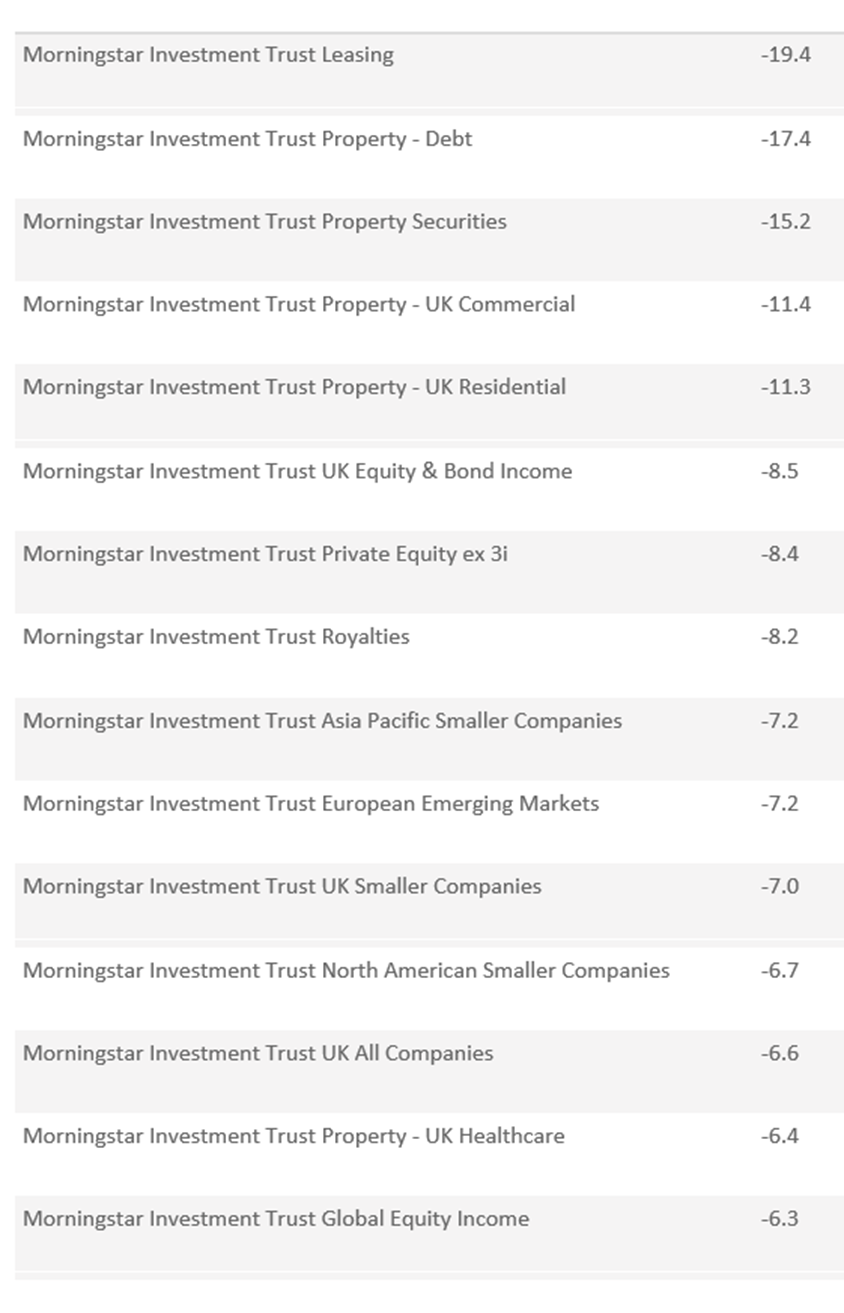
 Source: Morningstar
Unsurprisingly the discounts of aircraft leasing funds and property funds have widened the most. The UK equity sectors have also seen significant widening, we suspect because of an increasing bearishness about the UK and the attached Brexit risks.
At the other end of the scale, not included in the table, the commodities sector has seen the biggest narrowing of the discount (6.8%). This narrowing has taken place across a variety of strategies in the sector: gold, oil, general natural resources and uranium. Among the other sectors to see their discounts tighten is biotechnology and healthcare (4.2%), which is perhaps self-explanatory.
Which areas look like good value?
Generally speaking, more cyclically exposed or ‘risk-on’ sectors look like good value at the moment. This includes the smaller companies sectors (across the board), emerging markets and Europe (we discussed the beta of Europe to the global economy in a recent strategy piece).
BlackRock Frontiers (BRFI) is an example of a trust within these areas, currently trading on a discount of around 6%. While this figure is not wide in absolute terms, BRFI has often traded on a premium and is the leading fund for investing in the lesser emerging markets – including the frontier markets. Once the current economic crisis has worked its way through, in our view, the traditional uncorrelated growth of the frontier markets should resume. With the universe being extremely cheap, recent recovery might indicate that, on a NAV level, the bad news is all in the price.
The continuing uncertainty surrounding Brexit has meant that the UK has stayed out of favour, and as a result looks relatively cheap. This situation comes in the midst of a deep controversy about the handling of the pandemic. At a sectoral level, UK commercial property has been particularly hard hit and, with discounts in the high 30s and 40s, we think there may be value there. This includes trusts like Picton Property Income and Standard Life Property – both of which are trading at discounts greater than 20% in spite of demonstrated excellent long term track records.
Alongside this, there are a number of UK equity funds, focusing on small or large cap stocks, that could be considered attractively valued. River and Mercantile UK Smaller (RRMC) is a good example. The trust now trades on a wide discount of c. 20%, despite strong NAV returns. We think this may be a reflection of the relatively illiquid nature of the shares, with the trust operating a policy of returning capital to shareholders to deliberately keep assets at a relatively low level. This may deter institutional investors, wary of liquidity risks. The evidence suggests that retail investors also remain wary of UK assets generally. However, a normalisation of activity and conditions could catalyse a discount narrowing in RMMC if investors reappraise the opportunities available in UK small caps and take note of RMMC's strong NAV performance.
JPMorgan Midcap (JMF) is another example of a trust within the UK that could offer a potentially attractive entry point. JMF is currently at a discount of c. 11.6%. In our recent research on this trust, we noted that discounts at slightly wider levels (c. 14.4%) had tended, under the current manager's tenure, to see strong subsequent NAV and share price performance over the next 12 months. This also holds true at the current level. Mid-caps relative performance in the short term is likely to reflect the current negative investor sentiment towards the UK. However, a discount at this level or greater has in recent years tended to suggest that this is the bottom and the pessimism is more than reflected in the share price. Any improvement in UK sentiment would be directly reflected not only in an upturn in NAV performance but also in a narrowing of the discount, both of which would benefit JMF.
Investment trusts are particularly attractive when markets fall and discounts widen. A subsequent improvement in sentiment would lead to a sharp upturn in share price, reflecting the improvement in the narrowing of NAV and discounts. We believe the current market levels give investors an interesting buying opportunity.

Read the latest edition of DIY Investor Magazine

DIY Investor Magazine
The views and opinions expressed by the author, DIY Investor Magazine or associated third parties may not necessarily represent views expressed or reflected by EQi.
The content in DIY Investor Magazine is non-partisan and we receive no commissions or incentives from anything featured in the magazine.
The value of investments can fall as well as rise and any income from them is not guaranteed and you may get back less than you invested. Past performance is not a guide to future performance.
DIY Investor Magazine delivers education and information, it does not offer advice. Copyright© DIY Investor (2016) Ltd, Registered in England and Wales. No. 9978366 Registered office: Mill Barn, Mill Lane, Chiddingstone, Kent TN8 7AA.