
Underground bangers: looking for hidden gems in smaller investment trusts
This is not substantive investment research or a research recommendation, as it does not constitute substantive research or analysis. This material should be considered as general market commentary.

Smaller investment trusts have been under pressure with demand reduced by consolidation in the wealth management industry and the increasing use of centralized buy lists by DFMs and advisers
If a large amount of money is being managed to a model, allocations can be impossible to deal into a small trust; anecdotally, the lower limit of viable size for professionals has been rising with £200m a realistic cut off point, and the lower charges and greater liquidity of larger vehicles makes them more attractive in the current environment.
The COVID-19 pandemic has increased this pressure; concerns about market direction and worsening personal circumstances has reduced the ability or willingness to invest and investment trust industry assets over the first half of 2020 were flat.
Average discounts in the universe have risen from c. 1.9% at the end of January to c. 8.6% by the end of June; wide discounts can bring the long-term viability of a vehicle into play, and the lack of investment demand creates greater competition for capital, potentially further starving the smallest trusts.
However there are many investors, such as wealth managers with greater discretion over which funds they can use and retail investors, who do not have the same liquidity restrictions or requirement to use model portfolios or buy lists.
For them the 50% of investment trusts with less than £200m in market cap offer opportunities their peers can’t or won’t access; some smaller trusts are clearly differentiated from large trust strategies, offering diverse asset exposure and sources of alpha.
The pandemic could lead to an alternative source of return: wind ups or mergers which close persistent discounts. The merger of Perpetual Income & Growth and Murray Income show boards are willing to take extreme action; the board of the £24m JPMorgan Brazil has recommended that shareholders vote against continuation at its AGM - rollover into BlackRock Latin American would seem the most likely option.
Small trusts, which are not clearly differentiated, could follow suit if they can’t stand out and grow, either through share issuance or organically thanks to outstanding performance; here we consider some advantages and disadvantages of smaller trusts, and some funds which stand out to us as offering differentiate strategies with the potential to grow.
Discount
Smaller trusts offer investors a greater opportunity to buy on a discount; this table sorts all AIC investment companies by net assets, splits them into £100m bins and calculates the average discount for each bin. The trend line shows a clear relationship between size and discount.
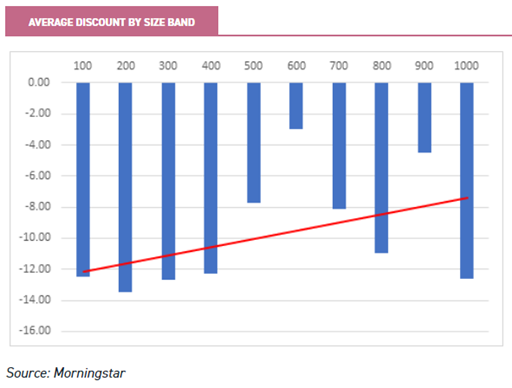
The high score for the largest bracket is due to one trust, BMO Commercial Property Trust, which sits on a 50% discount to NAV, reflecting the extreme uncertainty in the commercial property market; if property sectors are excluded the relationship is even stronger.
Not all small trusts trade on wider discounts than their larger peers; demand can be strong for some that have carved out a niche, allowing the examples below to grow into large ones by issuing shares while trading on a premium.
Nevertheless there are reasons a smaller trust might trade on a wider discount; the inability or unwillingness of certain buyers to get involved, smaller marketing budgets leading to lower awareness even if performance is good and the strategy differentiated, and higher charges could all be factors.
Liquidity
Low stock liquidity and trading volumes can become self-fulfilling for some smaller trusts, and is a reason for them to trade on a wider discount; if selling is more costly, it stands to reason that an investor would demand a greater discount to the value of the assets when buying
Large, professional investors may be less willing to take stakes they cannot be sure of unloading at a good price; this can also lead to wide bid-offer spreads, further deterring investors.
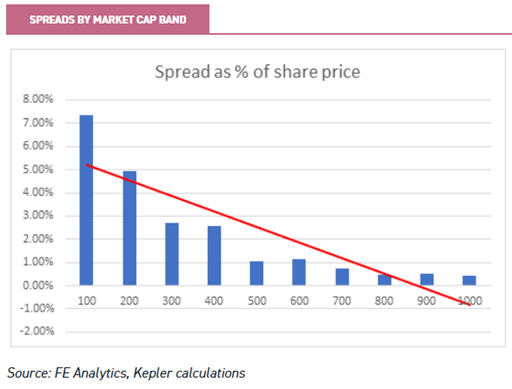
Liquidity is measured by the average amount of shares traded each day, whereas what most investors are interested in is the cost of buying and selling; it is therefore perhaps best measured by spreads, as in the graph below.
Again, the investment trust universe in £100m brackets up to £1bn, then the average bid/offer spread as a percentage of the mid-price; the reduction in the cost of buying and selling is dramatic until the £400-£500m bracket, then it continues to generally decline, but at a slower rate.
One of the few disadvantages of closed-ended funds relates to smaller funds; a smaller trust has less liquidity in the shares, whereas an open-ended fund depends upon the liquidity of the underlying investments in the market – small open-ended funds can be just as liquid as larger ones.
This averaged data masks wide dispersion; there are plenty of trusts with more modest spreads at a lower size, but a greater risk that the spread could widen in adverse circumstances, highlighting the importance of understanding the liquidity of a small trust and being selective.
Performance
So, do smaller trusts offer a performance advantage to compensate for the extra discount and liquidity risk? We found no such advantage, in fact the larger trusts from five years ago have outperformed since then on an NAV total return basis.
This chart shows that the average five year return was c. 6.12% annualised for the entire AIC universe; returns on average were much weaker for those under £100m at the beginning of the period and there is minimal difference for the other age bands.
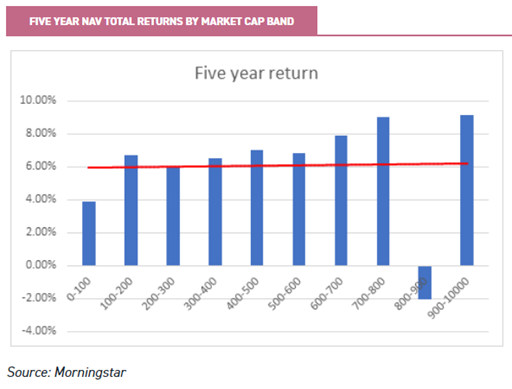
Poor returns for the sub-£100m trusts reflects a couple of factors.
Firstly, successful trusts grow over time – either through performance or equity raises - and the band will contain some future successes; however it will also contain trusts that have been perennial poor performers and have shrunk.
Secondly, there are a number of idiosyncratic trusts that target a small pool of investors or with large family holdings, some of which have performed poorly.
Conclusions
Smaller trusts tend to trade on wider discounts, which is at least partly explained by their larger spreads; plenty of individual trusts buck these trends and by doing so they grow and attract a wider circle of buyers.
Trusts which are doing poorly tend to fall in size or struggle to grow and average performance, discount and liquidity for small trusts is biased downwards.
What this really means is that this is a very exciting place to be looking for investments - hidden in the crowd are the large trusts of tomorrow.
That certain types of investor simply can’t invest at this size means that there is a greater chance to get in early and potentially enjoy the best returns, perhaps super-charged by a wide discount due to lower liquidity in this part of the market.
Seemingly intractable discounts on strongly performing trusts may become more pliable when the trust hits a certain level of assets; detailed research is key to getting this right as investors look for differentiated strategies, able to excite investors as long-term plays.
Alternatively investors could look for trusts which do similar things to their larger peers, but have fallen out of favour or made some mistakes; this situation could be a potential turnaround story.
If not, a wind-up or merger could occur, offering the consolation prize of an exit close to NAV or a narrowing discount after a successful merger; here are some trusts below £200m we think are worth consideration.
Sub-£100m
AIE
Ashoka India Equity (AIE) - by some way, the best-performing India trust since in July 2018 (see our recent note). It’s net assets are just £73m but, prior to the coronavirus crash, traded on a premium, regularly issuing shares.
As India struggles with the pandemic, AIE currently sits on a small discount of c. 2.8%, which is much tighter than its peers focusing on the country, which suggests investors are in or the long term; the spread is modest at c. 2.9%, and we expect the board to continue to grow the trust once the premium returns.
The trust has a performance fee only structure which limits the drag on the performance of small funds, as well as the hit shareholders bear from fixed costs making up a greater percentage of net assets.
HOT
Henderson Opportunities Trust (HOT) invests in small and mid-cap UK equities with a contrarian approach; it has an excellent long-term track record, but has struggled over a five year horizon.
The trust has £78m in net assets and a market cap of just £64m; structural gearing is high so the trust has suffered in market crashes, such as earlier in 2020.
HOT is very much a risk-on trust - in the 2013/4 mid-cap rally the trust did exceptionally well, even trading on a premium.
With the UK market out of favour, and the economic outlook poor, it currently trades on a 14% discount; timing is key with an investment in HOT as it is highly geared to a UK recovery.
It’s wide spread of c. 7.3% might make it even more important to invest with a long-term view, but the level of discount, to an already out-of-favour asset class, suggests there could be long-term value. It is notable that trust-of-investment trusts Miton Global Opportunities (MIGO) retains a reasonable position in HOT.
BEE
Baring Emerging Europe (BEE) is the only AIC fund focused on emerging Europe; this region tends to be cyclical, and it has been a difficult year for the trust, with NAV down c. 17%.
However, the region has fared reasonably well in terms of controlling the medical and economic impact of the virus (see a recent note); BEE has shrunk to £92m in net assets but a modest spread of c. 1.52%, suggests reasonable liquidity.
The trust is focused on a region which trades on extremely low valuations, and would be highly geared to a recovering global economy;it trades on an 11% discount and offers a 5.3% historic dividend yield. The payout is supported by the ability to distribute up to 1% of NAV each quarter.
£100m-£200m
AJOT
AVI Japan Opportunity Trust (AJOT) has a highly differentiated approach and clearly defined investment strategy; it has traded on a premium for much of the time since launch in 2018.
AJOT has regularly issued shares, and has grown to £117m; despite the pandemic, it is back on a 1.4% premium and issued shares in June.
We believe that the direction of travel is clear, and that AJOT is a good candidate to grow significantly and bring the added benefits of extra liquidity to shareholders as it grows.
At c. 3.9% it’s spread is higher than some of the other trusts here, thinner trading volumes a result of a lack of willing sellers relative to buyers – as indicated by the persistent premium.
AJOT focuses on finding cheap Japanese companies, mainly small-caps, with large amounts of cash or securities on the balance sheet, and unlocking this value. We discuss this in full detail in our note on the trust.
CCJI
At £177m CC Japan Income & Growth (CCJI) is close to the £200m threshold which could open up a broader shareholder base; it is the only trust in the AIC Japan sector with an income remit, and trades on a historic dividend yield of 3.8%.
Historically it has traded on a premium, but slipped onto a discount as the coronavirus crisis resulted in a poor period of relative performance – see our recent note.
Structural gearing of 20% in a relatively indiscriminate market sell-off meant that NAV returns suffered on a relative basis in the aftermath of the pandemic; with high levels of stock correlation mitigating the defensive characteristics the stock picking process usually emphasises.
As with AJOT, the board has been aggressive in looking to grow the trust when it has traded on a premium. Despite the larger size the spread is reasonably wide at c. 4.9%. The shareholder base is reasonably concentrated, with 42% held by shareholders with over 3% of the shares (as of our latest note).
Click to visit:

Past performance is not a reliable indicator of future results. The value of investments can fall as well as rise and you may get back less than you invested when you decide to sell your investments. It is strongly recommended that Independent financial advice should be taken before entering into any financial transaction.
Read the latest edition of DIY Investor Magazine
DIY Investor Magazine
The views and opinions expressed by the author, DIY Investor Magazine or associated third parties may not necessarily represent views expressed or reflected by EQi.
The content in DIY Investor Magazine is non-partisan and we receive no commissions or incentives from anything featured in the magazine.
The value of investments can fall as well as rise and any income from them is not guaranteed and you may get back less than you invested. Past performance is not a guide to future performance.
DIY Investor Magazine delivers education and information, it does not offer advice. Copyright© DIY Investor (2016) Ltd, Registered in England and Wales. No. 9978366 Registered office: Mill Barn, Mill Lane, Chiddingstone, Kent TN8 7AA.