
Investment Trust Ratings 2024
Categories: Getting started: key topics
Our ratings seek to reward closed-ended funds which deliver attractive and persistent performance characteristics in three categories which we think match up to broad goals investors usually have: long-term growth, income and growth, and high current income. This includes strong performance versus a fund’s underlying market, as well as attractive risk characteristics which we think suggests they could continue to be premium options for investors looking for active exposure. Our ratings are purely quantitative, meaning the largest asset managers and boutiques are treated alike, and no commercial interests can interfere. In fact, only 56% of the trusts winning ratings this year are clients of ours, down from 59% last year.
Quant ratings are of necessity backward-looking, and tell us what has happened not what will happen. But we have tried to build in risk metrics to the calculations which may be more stable than alpha, as even for the best managers alpha is likely to be cyclical (for the full methodology, see the appendix at the end of this article). Our ratings also use benchmarks which are specific to the style of the manager. This means we are less likely to reward a manager when his or her style is in favour, but equally, we may be rewarding performance in a style which is on the verge of a rough patch. We think this means our ratings provide a palette of funds with different styles and strategies, all of which have a proven track record of strong risk-adjusted performance and a stable management team. They could be a good starting point for fund selection, although we think any selection process should include consideration of qualitative factors and changing macro conditions and correlations.
2024 Growth Rated funds
Our ratings look over five years, to try to give a decent amount of time for a track record to build up and to allow us to assess a fund’s performance in different market environments. The five years to the end of December 2023 saw a strong rally in growth in 2019, in tech, ecommerce and China in 2020 and then a surge in value over growth in 2021 and 2022, initially in a rising market and then in a terrible 2022. Last year, meanwhile, saw choppy style performance, with many markets ending, and looking cheap by historical standards, with the most glaring exception being US large-cap tech.
One of the interesting features of this year’s list of funds is that a number of income-focused funds have done very well in total return terms, perhaps boosted by strong performance from value stocks at times. This includes Dunedin Income Growth (DIG) and Murray Income Trust (MUT) as well as JPMorgan Global Emerging Markets Income (JEMI). However, overall, there is a broad stylistic spread of funds, as the below table shows. Our Growth / Value Scores and Quality Scores are derived from underlying Morningstar data on which we have performed some calculations to try to build a picture of how funds compare. Both scores are relative, but relative to the underlying universe of funds, i.e. all funds scored, not just the ratings winners. As such, we think the broad spread of Growth (high) versus Value (low) scores is interesting, and suggests we are managing to reward alpha rather than style bias. We do think, however, that strong total returns from equity income funds could be a feature of the coming years, as we discussed in a recent strategy note. Low starting valuations, meaning high yields, and a higher interest rate environment could be creating a good setup for the strategy.
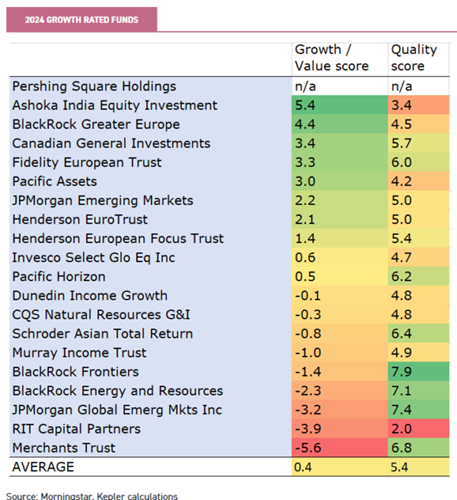
One trust worth highlighting in the above list is Ashoka India Equity (AIE). This is the first year AIE has had a track record long enough to be rated, and it has shot to the top of the rankings. While India has had a strong run, that is largely irrelevant to the rating, which is due to the trust’s outstanding active record. Our growth ratings are based on the information ratio and the upside/ downside capture ratio, and on both metrics, AIE has scored very well.
2024 Income & Growth Rated funds
A striking feature of the Income & Growth Rated Funds this year is the number of small and mid-cap-focussed funds. These ratings first apply the same filters as for the growth ratings, and then look at income. We screen for funds which have delivered annualised income growth of 3% or more over five years, and then for those which have a starting yield of 3% or more. These funds are intended to be appealing to an investor who wants to draw a growing income stream over many years, while hopefully growing their capital too, as well as to those who like the more defensive attributes of equity income as a total return strategy. It is the 3% initial yield filter which has seen a number of SMID-cap funds qualify this year. Rock-bottom valuations, particularly in the UK, have created a really interesting opportunity. While a fund like Schroder UK Mid Cap (SCP) is obviously interesting as a long-term growth play – the FTSE 250 has historically been one of the best-performing growth markets – at the time of writing you can buy the shares on a 3% yield. For both classes of investors referred to above, this seems pretty exciting. Similar arguments could be made for Mercantile (MRC) and Schroder Oriental Income (SOI).
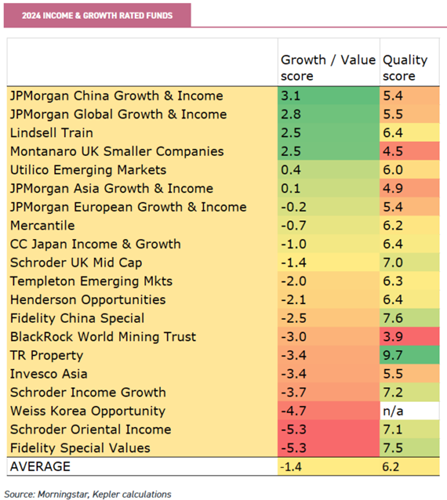
There’s more of a value bias to the above list, as you would expect from a list of income funds, but there are a number with a decent growth bias too. Notable are JPMorgan China Growth & Income (JCGI) and JPMorgan Global Growth & Income (JGGI). These trusts pay a fixed percentage of capital out as a dividend rather than relying on the income from investments to fund it. The drawback of this approach is that if the value of the portfolio falls, the dividend will too. However, both these trusts have delivered strong annualised dividend growth over the past five years, illustrating the power of the approach over the long run. JCGI will need to see good capital returns this year to maintain this strong dividend-growth record, given the falls in the Chinese market over 2023.
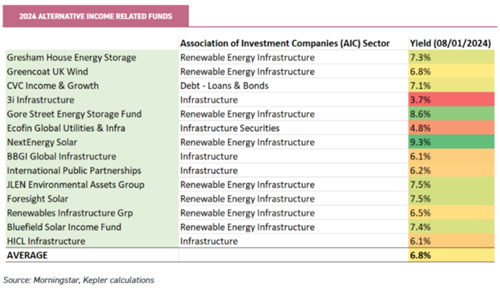
2024 Alternative Income Rated funds
What is alternative income all about? Many of the funds do offer some diversification benefits, but ultimately, we think they are there to offer a high immediate yield to investors who are less concerned about capital growth. This is a relatively young space, with many new asset classes appearing over the years, and historically there haven’t been many funds with the track record. Additionally, this kind of strategy can often end up seeing capital depleted. For this rating, we look across the sectors to reward those that have managed to maintain or grow both their dividend and their NAV over five years. In our view, this rating rewards those that have ‘proof of concept’ and could be a starting point for investigation. It’s interesting to see the first energy storage fund appear on the list this year—Gresham House Energy Storage (GRID)—reflecting the growing maturity of that asset class. As many as 14 funds made the cut this year, up from 11 in 2023.
Performance of 2023 lists
Last year was an odd one for markets. For much of the year, high interest rates and high inflation created an environment of fear about an upcoming recession. Equity returns were muted, bonds did poorly, and many investors preferred cash accounts to cheap equities. But it ended with a flurry of excitement, as hopes of any recession being mild in the US and UK increased. There were some potential signs of a broadening of performance in the US equity market too, as lagging equities started to catch up with the strong performance of the ‘Magnificent Seven’. While our ratings take a long-term view on performance, it is still interesting to see how last year’s winners performed through all this.
Pershing Square Holdings (PSH) was the strongest performer in absolute terms, although its 26.8% wasn’t enough to keep up to a benchmark heavy in large-cap tech. BlackRock Greater Europe (BRGE) also delivered over 20% and outperformed Europe ex-UK equity markets substantially. The worst performers were in China and resources, with the materials markets affected by the slow recovery in China and by falling energy prices.
There wasn’t really any pattern in terms of growth or value outperforming, which aligns with our observation that excluding the performance of the Magnificent Seven, style wasn’t as important in 2023 as it had been in the previous few years. Notably though, three European funds are near the top, reflecting perhaps that equities have done well in the region even as recession fears mount, and perhaps also that it is easier to deliver alpha in that market than in the US.
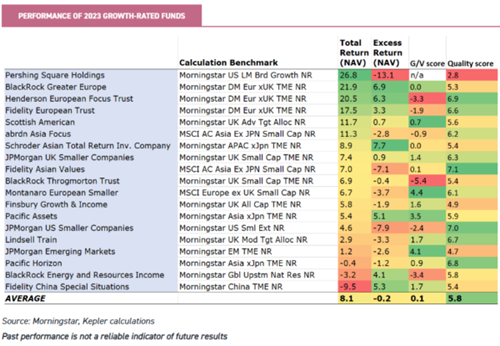
The top performers of the Income & Growth rated funds include TR Property (TRY). TRY invests in the equities of real estate companies, and its strong returns of 17% on the year indicate that a recovery may have begun in this troubled sector. Also delivering good returns was Utilico Emerging Markets (UEM), which was boosted by holdings in the digital infrastructure space. The worst performers included China and materials portfolios, as well as Weiss Korea Opportunity Fund (WKOF), which suffered due to an underweight to Samsung.

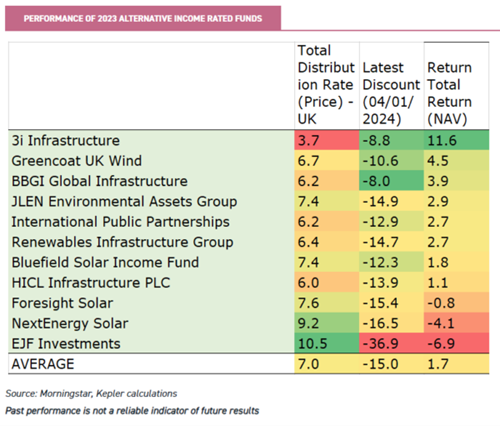
Short-term returns are probably even less interesting when it comes to the Alternative Income Rated Funds. However, many have been under pressure at the NAV and the share price level due to high interest rates. The NAVs, which are mostly self-reported, generally delivered positive returns, with an average of 1.7%. Share prices have moved to significant discounts in all cases though, with an average of 15%. This compares to an average discount of 2.5% at the end of 2023 and means the average yield on offer is now 7%, up from 5.6% a year earlier. With rate cuts seeming likely to come earlier than previously expected, we think this part of the market could deliver interesting returns over the coming years.
Conclusions
If you want cynicism about active management then there is plenty on offer these days, but to mangle a quote by a former prime minister on a slightly different topic, we think passive investing is a philosophy of failure. The investment trust space is full of talented managers with interesting and idiosyncratic strategies that have delivered excellent returns to investors over the long run, and our ratings hope to highlight some of the best. It goes without saying, that past performance patterns cannot be guaranteed to repeat, but we think there is a variety of strategies winning a rating this year with the potential to outperform in multiple environments. It is the portfolio construction task to put these together in such a way as to balance risks and opportunities, and we can’t help our readers with that. But we think these lists could be a starting point for research.
Appendix: Our methodology
To identify the top growth trusts, we start by looking at performance versus the benchmark. For us, the information ratio is the key metric. This looks at the outperformance of a fund versus its benchmark and then relates this to the extent of divergence from the benchmark or the extra risk taken. In other words, it seeks to identify whether the active risk relative to the benchmark taken by the manager has been rewarded with outperformance. We then look at the performance of a fund in rising markets versus its performance in falling markets—the upside/downside capture ratio. We think this has two attractions. The first is that it reflects the ‘loss aversion’ of the average investor. Behavioural finance teaches us that investors prize avoiding loss more than they do achieving a quantitatively equivalent gain. This is captured by an upside/downside capture ratio above one, which means that the fund has a tendency to avoid losses by a more significant degree than it makes gains in rising markets. The second attraction is that it allows us to consider defensive and aggressive strategies on a more level playing field. A trust which does exceptionally well in rising markets and is level in falling markets could rank the same as a trust which protects very well in falling markets but only keeps up in rising markets.
In order to create fair comparisons between funds, we have divided our universe into ‘super sectors’ of asset classes: large and mid-cap equity funds, small-cap funds, fixed income, or equivalent funds and property funds. This is intended to reflect the fact that generating alpha, in particular, is much easier in small caps, so comparing small-cap managers with large-cap managers is unfair. It also overlooks the risks that small caps bring, such as volatility and illiquidity, which means that it is not inherently superior to large-cap investing despite the advantages with regard to alpha. We rank trusts within their ‘super sector’ on all quantitative metrics. In order to reward persistence, we review performance over a five-year time period, which makes it much harder for a single year to distort results. We also exclude trusts which have had a manager change in the past three years.
It perhaps goes without saying that all our analysis is based on NAV total return performance, which reflects the strategy and decisions made by the manager, rather than share price, which can reflect many other factors. As already discussed, we would never envisage such a rating being used on its own to determine investment decisions. Clearly, with investment trusts, the discount of the shares to NAV and the policies and the quality of the board all need to be considered too. As importantly, given that quantitative studies are backward-looking, investors need to make a judgement about the likelihood of past performance patterns persisting in ever-changing markets. By looking over a long time period, we hope to capture a broader set of market conditions, but some trends last for much longer than five years.
For our income and growth ratings, we start with the screens used for the growth ratings. We then look at current yield and dividend growth, over five years. To win the rating, a trust needs to have a 3% yield and 3% per annum dividend growth over the past five years as a minimum, allowing for high-yielding funds and dividend-growth funds to be considered together. Once we have screened out the trusts which don’t meet the yield and dividend-growth tests, we order the trusts by their quantitative score on our growth screens. We apply the same manager tenure screen. We do sense check the quantitative results and will jump in if we think an exception needs to be made, but our threshold for doing so is exceptionally high, as our intention is to present the numbers, not our opinions.
We have also introduced an alternative income rating in order to analyse the top performers in this relatively new and rapidly growing space. We think, for the most part, trusts in the infrastructure, renewables, and related sectors are held for a stable and high income, most likely by those living off their income. High yield is likely more important than income growth. We have developed a simple screen which shows those trusts which have at least maintained their NAV and their dividend, in nominal terms, over the past five years. With the alternative income space being relatively young, there are not many trusts with a long track record and just applying these two screens whittles the space down considerably.

Disclaimer
This is not substantive investment research or a research recommendation, as it does not constitute substantive research or analysis. This material should be considered as general market commentary.